The Last Word
Happy Presidential Primary season to those who celebrate! The GOP Iowa caucus was a show of force by the frontrunner in the face of staggeringly low turnout. We’ve been crunching the numbers on Iowa and thought you might enjoy some maps that we find tell the story well.
2024 GOP Caucus Vote Share
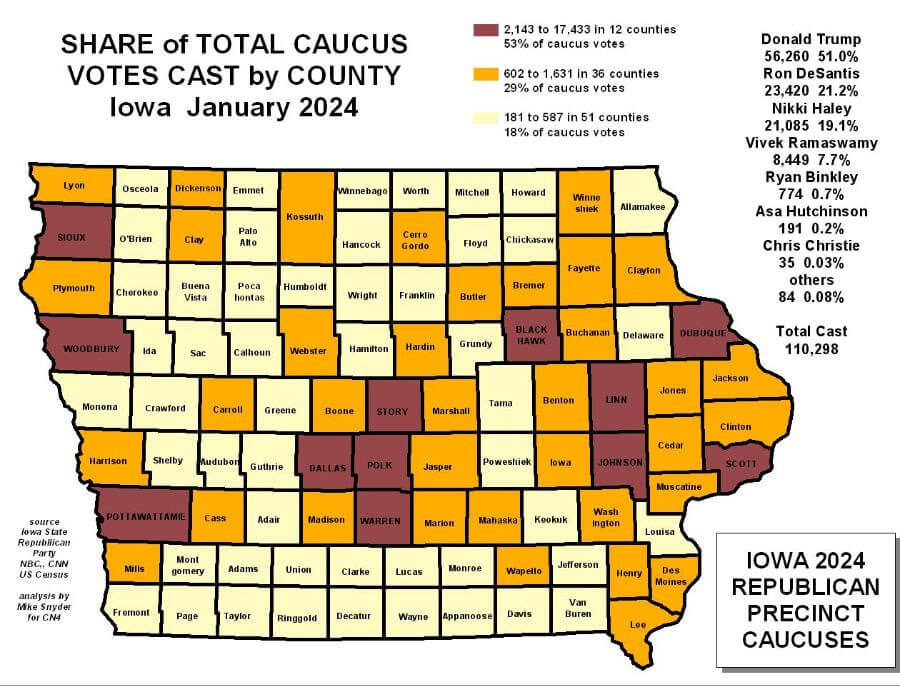
In terms of population density and voter clusters, Iowa is in the middle in more ways than one, between the more crowded states east of the Mississippi River, and the sparser populated states west of the Missouri River. This is even truer for Republicans than for Democrats.
Out of just over 110,000 Republican caucus voters this week, 12 larger counties accounted for over half (53%) of statewide caucus turnout. These counties are named in BOLD on the map.
The second tier of 36 middle-sized counties contributed 26% of total caucus turnout. The third tier of 51 smaller counties together accounted for 18% of statewide 2024 GOP caucus votes.
2016 Fall in Caucus Vote
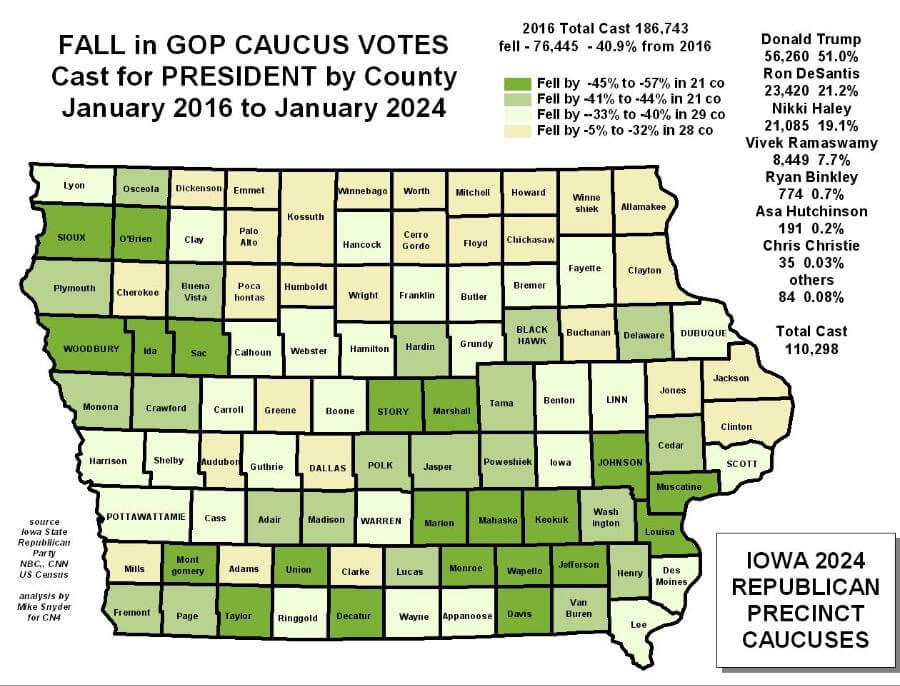
One striking fact about the 2024 Iowa GOP caucus is the sharp drop in votes cast; compared to January 2016, when nearly 189,000 participated, turnout fell by more than 76,000 (41%) statewide. Of course the record cold weather for THIS caucus no doubt had a major impact on turnout, and (perhaps) this map shows differences in local conditions on the night. The map and underlying numbers suggest that the fall in turnout was less in more pro-Trump counties.
On the other hand, it is possible that other factors were in play. Including reluctance of some previous, and new caucus attendees, to caucus for any Republican, including the front-runner and 2024 Iowa caucus winner. With negative impact on Republicans opposed to or leery about Trump, as well as potential crossover votes from Iowa Democrats.
In 21 counties, votes for President fell by more than 45% in 2024 compared with 2016; mostly in southern and northwestern Iowa. In the next tier of 21 counties, 2024 caucus turnout also fell by more than average, these counties also mainly in southeast and northwest. In the third tier of 29 counties, fall in GOP caucus vote was just below average, with these counties found across the state. The final tier of 28 counties had the least decline in total turnout compared to 2016, ranging from -5% to -32%; this group is most clustered in northeastern and north central Iowa.
First & Second Place: 2024
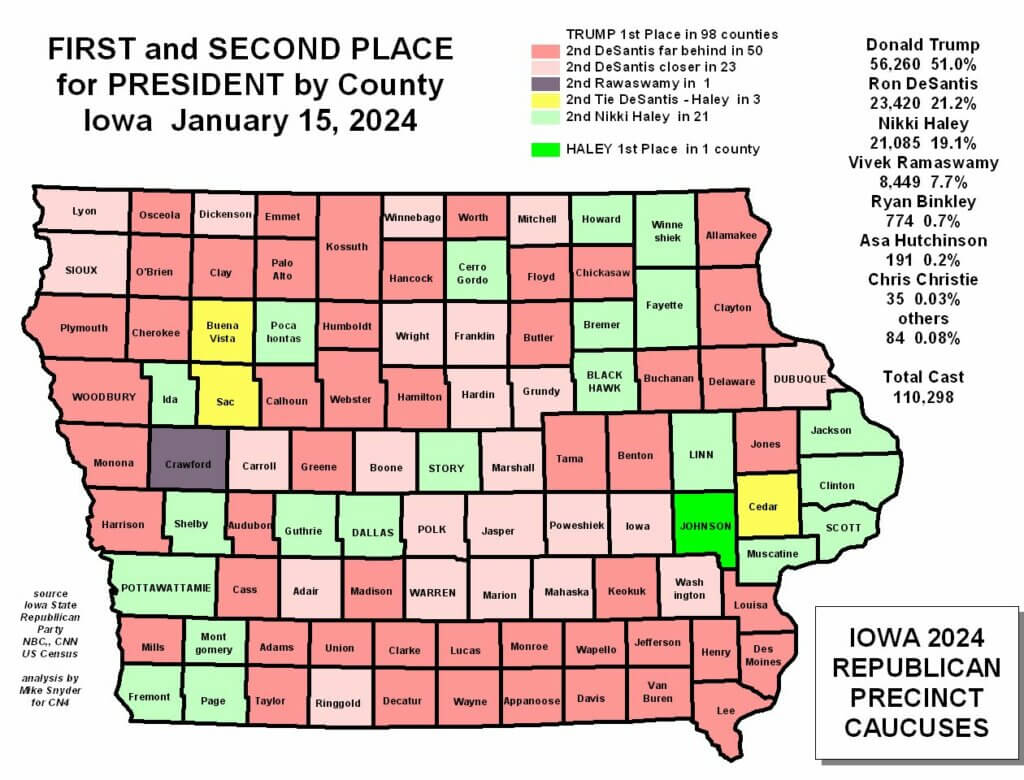
This map combines last Monday’s caucus results for all candidates, and in landscape where Trump won 98 of 99 counties (Haley first in Johnson by a single caucus vote) by focusing on which of his challengers ended up in second place from county-to-county.
DeSantis captured second but trailed Trump by more than 35% in 50 counties, including only 1 bigger county (Woodbury) but the mass of mid-to-smaller counties was not helpful to the Floridian; this group spanned the state, but was less prominent in central Iowa. DeSantis was also second in 23 counties where he was more competitive, trailing Trump by from -10% to -34% largely clustered in central and northern Iowa.
Ramaswamy was Trump’s number two follower in 1 rural county, his best statewide; plus there were 3 counties where DeSantis and Haley tied for second place. Haley came in second to her former boss in 21 counties.
First and Second Place: 2016
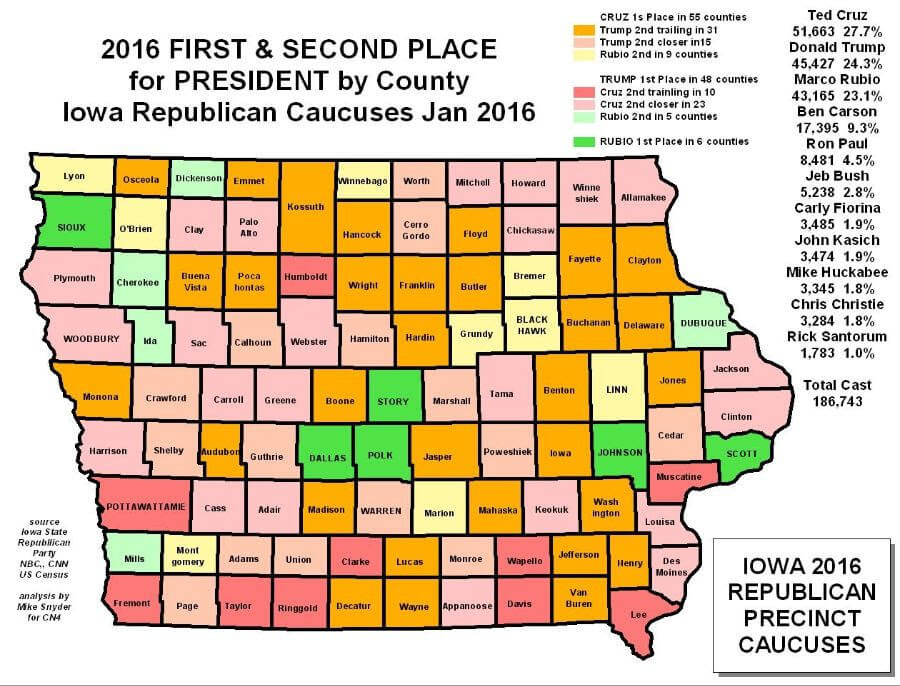
The 2016 unified candidate results from that year’s Iowa Republican caucus are rather different, naturally. Though some linkages with 2024 are discernable, most notably the Rubio-Haley connections in the next map and the changes in Trump’s performance outlined in the next section.
Haley 2024 share of Rubio 2016
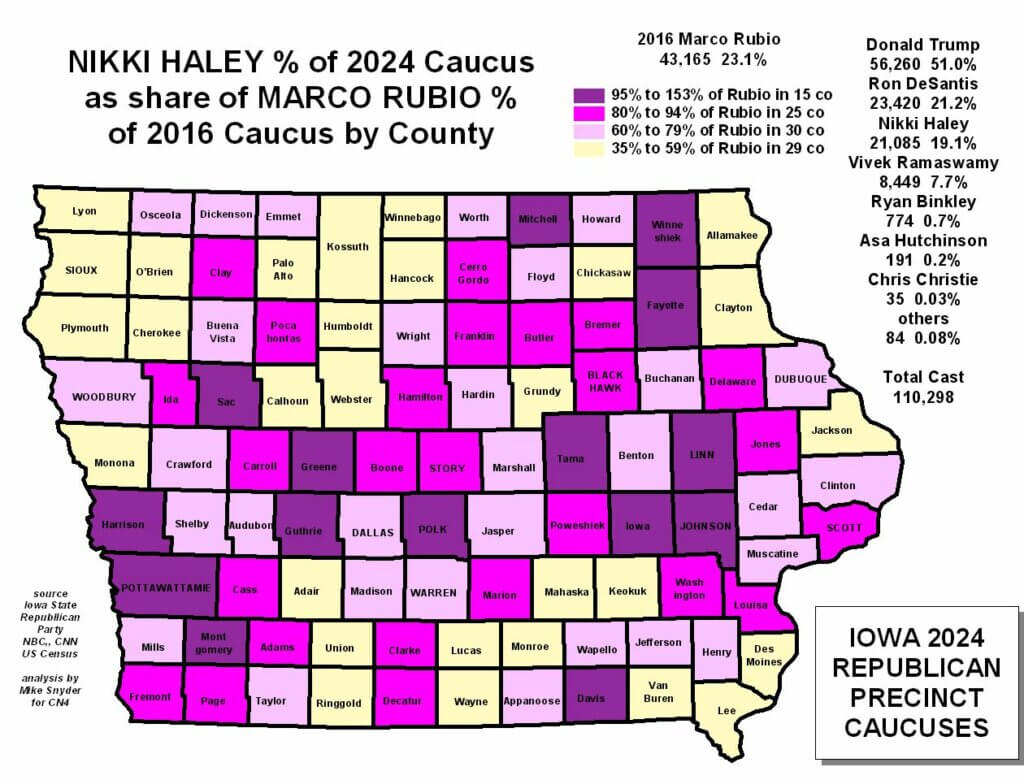
Beyond comparing Trump 2024 with Trump 2016, perhaps the next best compare and contrast involves the two candidates who claimed 3rd place in the Iowa Republican caucuses: Nikki Haley with 19.1% in 2024 versus Marco Rubio with 23.1% in 2016. In addition to placing the same in the final results, Haley and Rubio also appear to be roughly similar with respect to their political ideology – and also their caucus geography.
Donald Trump: 2024 Vote vs 2016
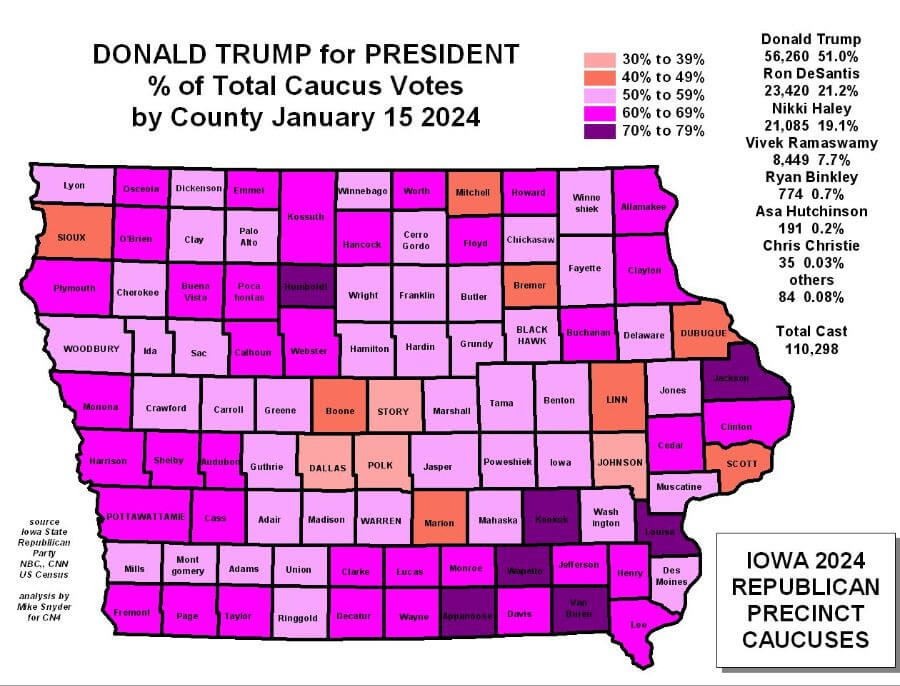
This map tells the story of Donald Trump’s impressive, but somewhat less than overwhelming dominance of the 2024 Iowa Republican caucus vote. Support for Trump is highest in a group of mostly southeastern counties where he garnered over 70%.
Percent Change from 2016
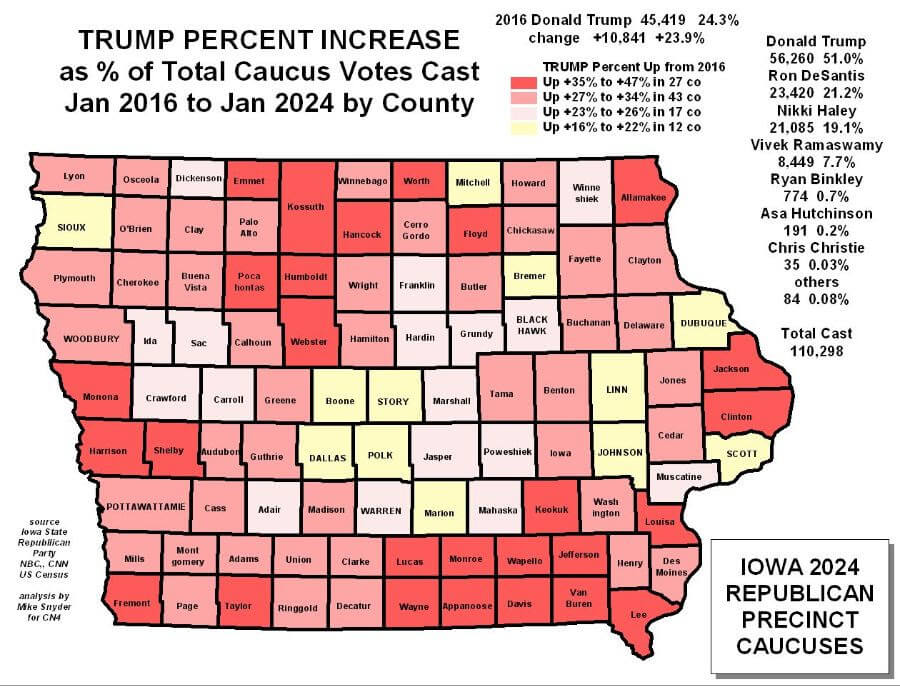
Southeast Iowa is also where we see the largest per capita increase in Trump support. However his dominance in rural, older counties extends statewide. That said, his vote share increased in all 99 counties.
Raw Vote Change from 2016
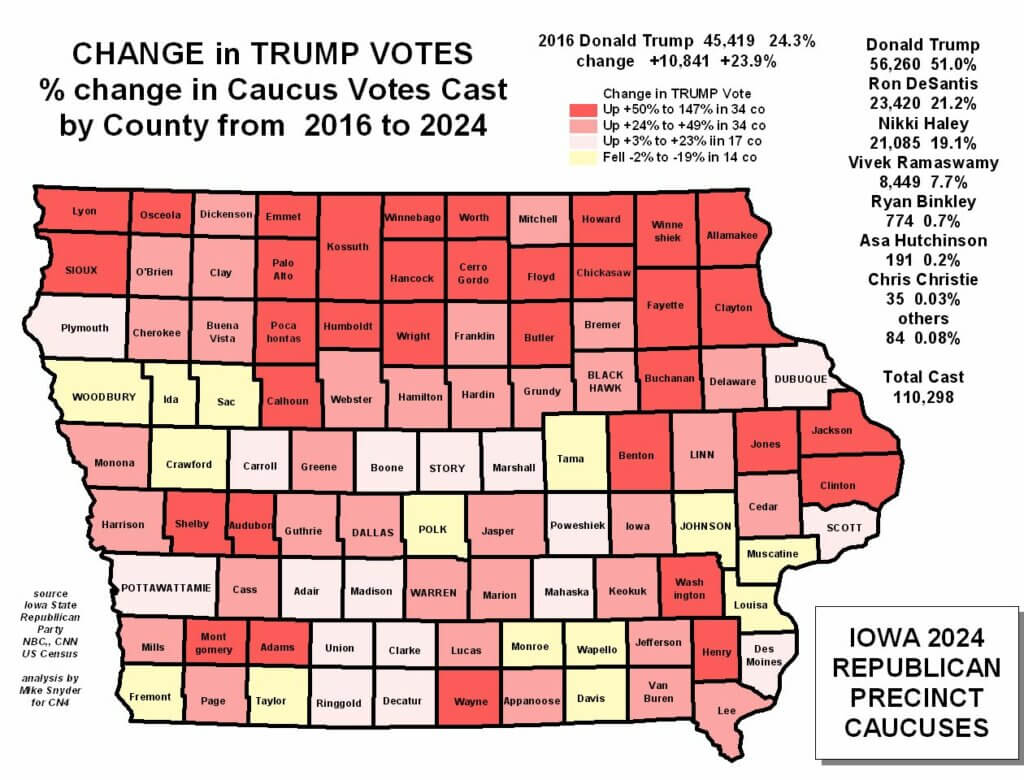
While total Iowa GOP caucus voter turnout fell by over 76,000 from 2016 to 2024, votes cast for Donald Trump increased by nearly 11,000, demonstrating his dominance in a state where he finished in second place behind Ted Cruz in January 2016.
Trump’s raw vote totals increased by over 50% in 34 mostly smaller, northern counties. He increased his total votes from 25% to 49% in another 34 counties. Trump’s vote increase was under 25% in 17 mostly southern Iowa counties. Trump’s raw vote fell from his 2016 caucus showing in 14 counties, including 3 of the larger ones across the state, which may say something about local weather, local Trump support, or both.
Haley 2024 Vote
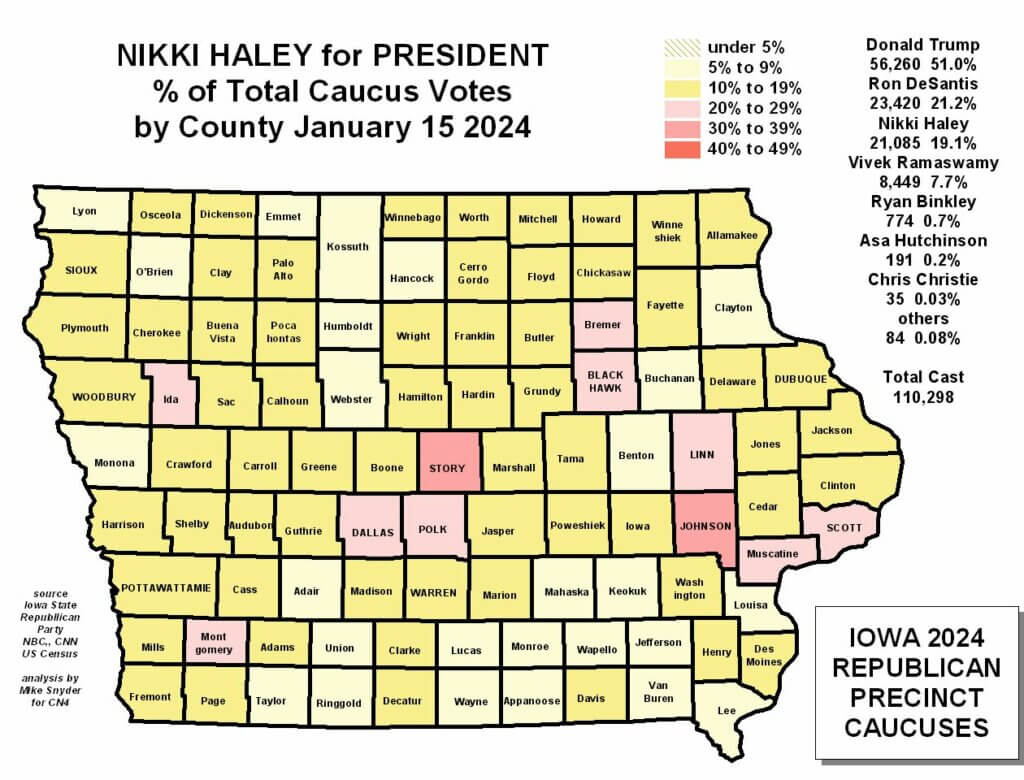 Of the 2024 GOP field, Nikki Haley had the least even geographic distribution of Iowa caucus support, which was surely a factor in her being pipped for 2nd place by DeSantis. Haley broke 30% in only 2 big, and big university, counties (Johnson, Story); and she performed above her statewide mark in only 9 other counties including 5 bigger (Black Hawk, Dallas, Linn, Polk, Scott).
The former SC governor and UN ambassador under-performed in a super-majority of Iowa counties, receiving under 10% in 26 counties, none large – but they added up against her.
DeSantis 2024 Vote
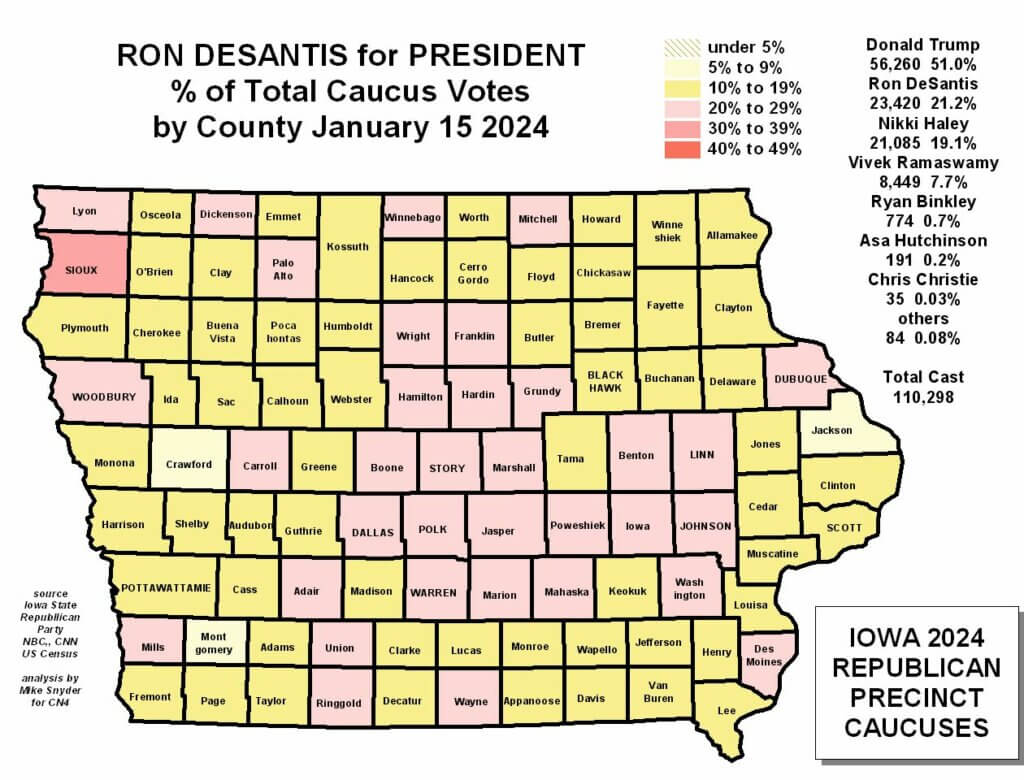 Ron DeSantis had the most even geographic distribution of Iowa caucus support of any candidate in the 2024 Republican race, which in turn was a major, indeed decisive factor, in earning him second place statewide, albeit a distant second to the winner. The Florida governor broke 30% in only one county (Sioux). He also performed at or above his statewide average of 21% in a group clustered in central Iowa but extending across the state. DeSantis under-performed in the rest of the state, including 3 of the biggest counties and was held to below 10% in three counties.
Ramaswamy 2024 Vote
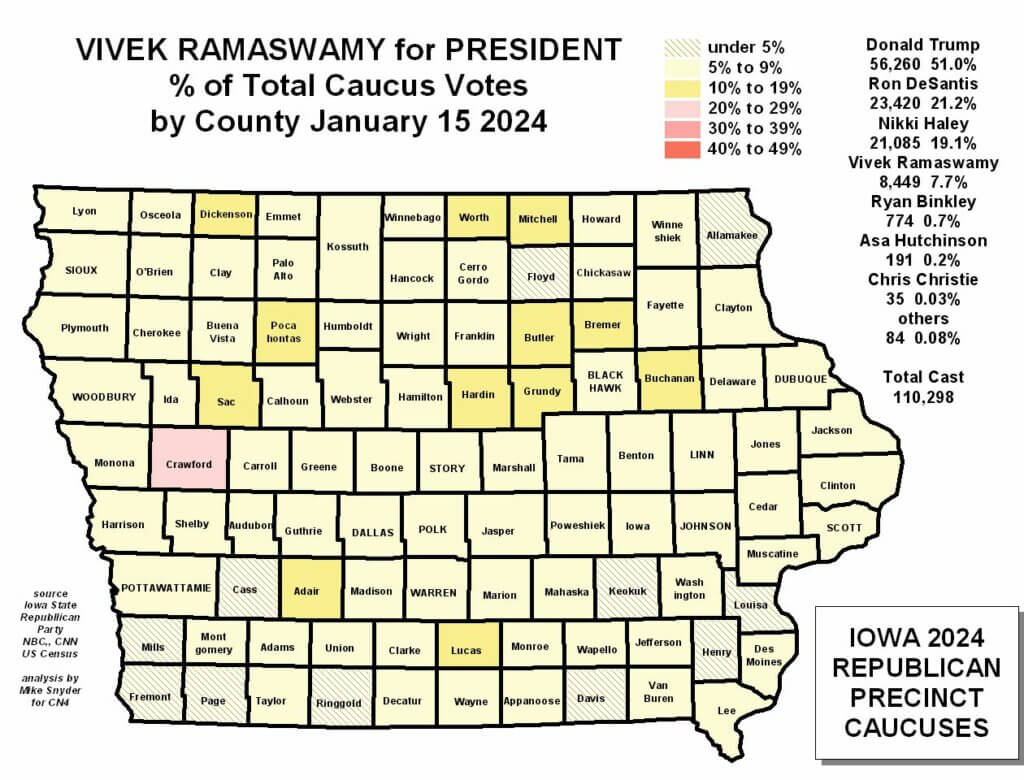
Vivek Ramaswamy left Iowa, and the 2024 POTUS race, in distant fourth place, registering a small but nonetheless significant impact upon the rest of the field; based on the numbers and geography, likely a negative impact on DeSantis and Haley, thus positive for Trump.
Ramaswamy broke 20% in just one smaller county, and cleared 10% in another dozen, none big, clustered in the northern part of the state.On the other hand, he posted below 5% in only 11 counties, mostly in southern Iowa.
If you want to talk more about Iowa, presidential politics, or how we can help your team navigate this national political climate, please reach out to us!